Site Description
The Athabasca River flows northeast from the Rocky Mountains through Alberta until it meets with the Mackenzie River and drains into the Arctic Ocean. Along its path, the Athabasca River flows through the Athabasca Oil Sands Region which encompasses the towns of Fort McMurray and Fort MacKay, Alberta (Figure 4.1, Figure 4.2). In this region, the Athabasca River is met by four tributary rivers which flow through open-pit mining activity: Mackay River, Muskeg River, Steep Bank River, and Tar River (denoted by prefix site abbreviations MK, MU, SB, and TA, respectively). Stream gauges and Alberta Environment and Parks water quality monitoring stations span 9 sites across the region. There is one site upstream of mining activity (denoted by abbreviation suffix site-up), and one site downstream of mining activity (denoted as abbreviation suffix site-dn) along each of the four tributary rivers. Additionally, along Muskeg river, there is a midstream site (MUmid).
Figure 4.1. Sonde placement and water chemistry sampling locations along four tributaries to the Athabasca River, near Fort Mackay, Alberta. Open pit mines are outlined in yellow, and rivers are delineated in purple (Mackay), red (Muskeg), blue (Steep Bank), and green (Tar).
Figure 4.2. The nine tributary monitoring locations are located within the dark red strip mining and drilling region of Alberta, north of Fort McMurray. From (Fick, 2008).
Figure 4.2. The nine tributary monitoring locations are located within the dark red strip mining and drilling region of Alberta, north of Fort McMurray. From (Fick, 2008).
Field Methods
|
Sonde and chemical data were collected at the 9 sites between March-2016 and December-2018 (Figure 5).
Sondes (Hydromet Hydrolab HL4 and YSI Inc. EXO2) were deployed >10 cm below the water surface and in continuous river flow. Dissolved oxygen, pH, redox potential, conductivity, water temperature, and turbidity were recorded at 15-minute intervals. Sondes were serviced, replaced, and calibrated on a monthly basis. A second sonde, calibrated within the previous 48 hours, was used to verify readings from the deployed sonde (Alberta Environment and Parks, 2006). All sonde data were smoothed to 1 h using a 4-point running mean. Chemical concentrations were sampled twice weekly in continuous river flow. Filtered phases are referred to as dissolved but are operationally defined as any particle or ion with diameter <0.45 µm. Samples were transported to laboratories at 4 °C. Total's samples were either preserved on site with nitric acid for trace element analysis or hydrochloric acid for mercury analysis. Lab Methods |
Figures 5.1-10, Photos along the Athabasca River and tributaries sampling locations, near the town of Fort Mackay.
|
|
Dissolved parameters were filtered through a 0.45 µm filter, and preserved with acid in the laboratory (Figure 6).
Total and dissolved major, minor, and trace elements (Al, As, Ba, Bo, Ca, Cl, Co, Cu, Fe, Li, Mg, Mn, Mo, N, Na, Ni, P, Pb, Sb, Sr, Th, Ti, U, V, Zn) were quantified by inductively coupled plasma mass spectrometry. Mercury was analyzed by Tekran-2600 Analysis. Cations were measured by inductively coupled plasma optical emission spectroscopy. Anions were measured by ion chromatography. Total and dissolved phosphorus, orthophosphate, total nitrogen, and organic carbon were determined calorimetrically. Total dissolved solid and total suspended solid concentrations were derived from weights measured from evaporated and dried materials of known original volumes. |
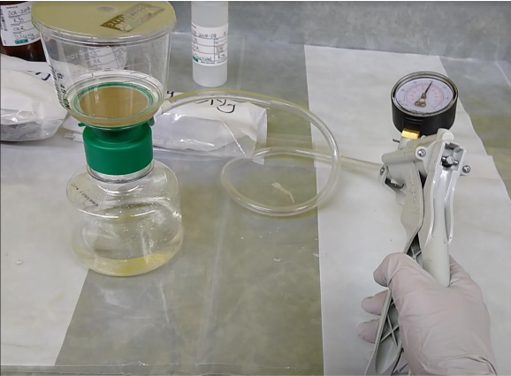
Figure 6. Sample filtering
|
Statistical Methods
All statistical analyses were performed in R Studio versions 1.1.463 and 1.4.1106.
T-tests were performed on upstream vs downstream order sites for the elements: Cu, Pb, V, As, Ni, Hg, N, the variables total suspended solids (TSS) and total dissolved solids (TDS), and the sonde variables: conductivity and turbidity.
Log-transformed and simple linear regression correlations were calculated between turbidity and concentration data, as well as conductivity and concentration data. Analyses were first performed on all data, and then by tributary system.
Principal Component Analysis (PCA) was performed on 5 subsets of data. (1) All data, including all 9 sites. (2) Mackay River, including sites: MKdn and MKup, (3) Muskeg River, including sites: MUdn, MUmid, and MUup, (4) Steep Bank River including sites: SBdn and SBup, (5) Tar River, including sites: TAdn and TAdn. The analyses were performed on transformed, centered, and standardized data (z-scores).
Discriminant analysis was performed on (1) all chemical and sonde data by site. A second discriminant analysis was performed on upstream versus downstream sites, excluding Muskeg Midstream. The analyses were performed on transformed, centered, and standardized z-score data.
perManova analysis was used to assess the proportion of variance explained by tributary system versus stream order relative to mine operations.
Disclaimer: all data and writing within this webpage are for statistics-training purposes only, and were performed on test data.
