Water Chemistry in the Athabasca Oil Sands Region Rivers: Univariate Summary Statistics
The tributaries in the Alberta Oil Sands Region had generally low total suspended solids concentrations, with a median of ~4 mg/L and mean of 12 mg/L (Figure 9). Average concentrations at downstream sites were 2 mg/L higher than upstream sites. Mackay downstream had notably high outliers, reaching 260 mg/L. Total dissolved solid concentrations were significantly higher than suspended sediment concentrations, with a median of 180 mg/L and mean of 205 mg/L. Dissolved organic carbon concentrations ranged from below detection to 40 mg/L, and had a mean and median of ~24 mg/L. Water was neutral to somewhat alkaline at all sites with an average pH of 7.9. However, MUmid and MUup had significantly lower median pH of ~7.3.
Turbidity was highly non-normal, with a range from 0 to 2000 fnu, with a median value of ~5 fnu, and mean of 29 fnu.
Conductivity ranged from 0 to 1200 µS/cm, with a median of 246 µS/cm and mean of 264 µS/cm.
Turbidity was highly non-normal, with a range from 0 to 2000 fnu, with a median value of ~5 fnu, and mean of 29 fnu.
Conductivity ranged from 0 to 1200 µS/cm, with a median of 246 µS/cm and mean of 264 µS/cm.
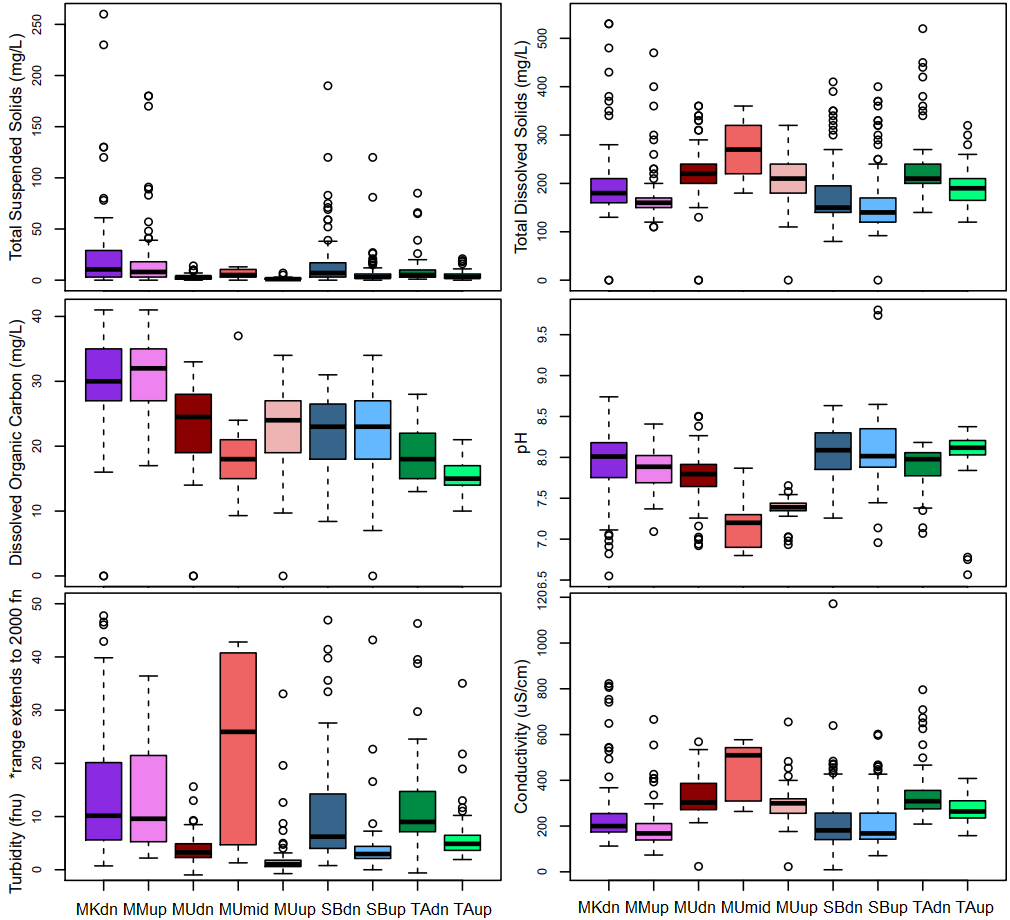
Figure 9. boxplots displaying the range and distribution of concentrations of: total suspended solids, total dissolved solids, dissolved organic carbon, pH (sonde), turbidity (sonde), and conductivity (sonde). Much of the data is non-normally distributed. The range of turbidity, which extends to 2000 fnu, is trunkated to enhance readability of the more common data.
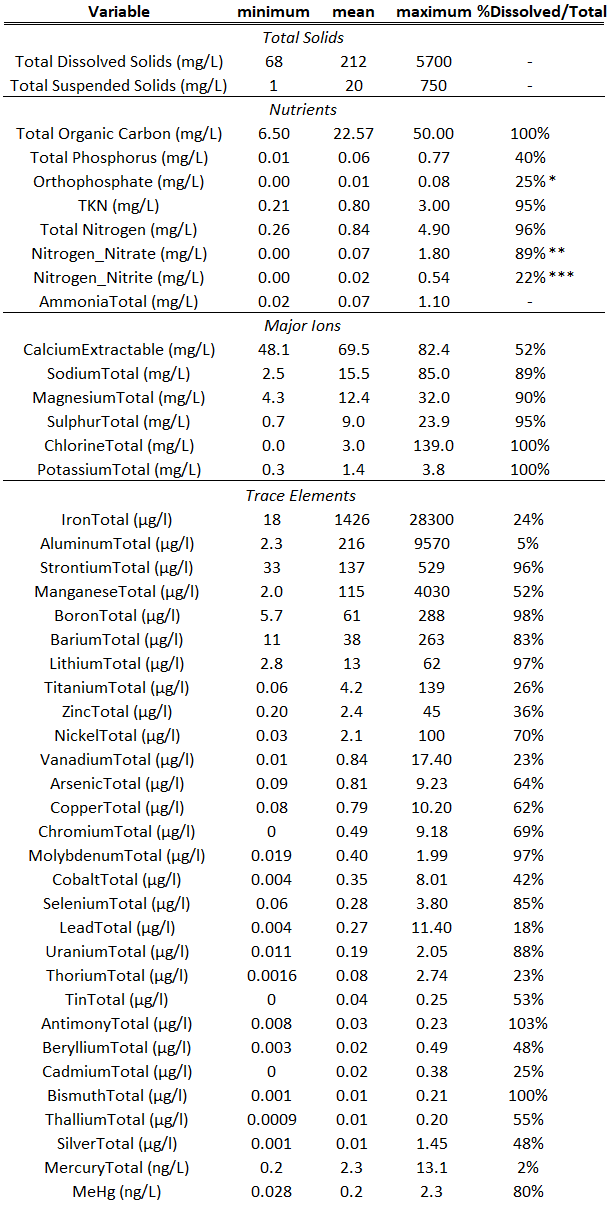
Copper ranged from 0 to 5.2 µg/L, with a median of 0.5 µg/L, and a dissolved/total ratio (D/T) of 80% (Figure 10). Lead ranged from 0 to 3.2 µg/L, with a median of 0.1 µg/L , and a low D/T ratio of 18%. Vanadium ranged from 0 to 6.9 µg/L, with a median of 0.4 µg/L, and a D/T ratio of 47%. Arsenic ranged from 0 to 2.5µg/L, with a median of 0.7 µg/L, and a D/T ratio of 76%. Nickel ranged from 0 to 10.8 µg/L, with a median of 1.3 µg/L, and D/T ratio of 78%. Mercury ranged from 0 to 7.8 ng/L, with a median of 1.8, and a D/T ratio of <80%. The full range of minimum, mean, maximum, and percentage dissolved out of total chemical variable concentrations are presented in Table 2.
A close inspection of the range of concentrations of Cu, Pb, V, As, Ni, and Hg concentrations at the 9 sites shows that these key trace elements were elevated at Mackay and Tar Rivers, and very low at Steep Bank and Muskeg Rivers.
The Canadian water quality guideline for the protection of aquatic life (CCME, http://st-ts.ccme.ca/en/) in the absence of hardness data is: copper (2 µg/L), lead (1 µg/L), nickel (25 µg/L), arsenic (5 µg/L), and mercury (26 ng/L). Guidelines were exceeded for Cu and Pb at the MKdn, MKup, SBdn, and TAdn sites (Figure 10). The copper guideline was exceeded in >3% of sampling events at all sites, and in 8% of sampling events at Mackay River. The lead guideline was also exceeded in 3% of sampling events, and in 8% of sampling events at Mackay River. These exceedances occurred primarily during May to July when river discharge is higher. It is important to note that the results of Quality Control studies for the Athabasca Oil Sands surface water monitoring program suggest that there is on average an 19% and 22% difference between replicates for copper and lead, respectively (Laceby et al., in press). This suggests that there may be a > 0.4 ug/L Cu and > 0.2 ug/L Pb difference between replicate analyses of stream samples which read above the CCME guideline. Additionally the sampling bias for potential environmental contamination are 44% and 25% for copper and lead respectively (Laceby et al., in press), meaning that blanks did not register as non detects in 44% and 25% of sampling events for the Quality Control Program.
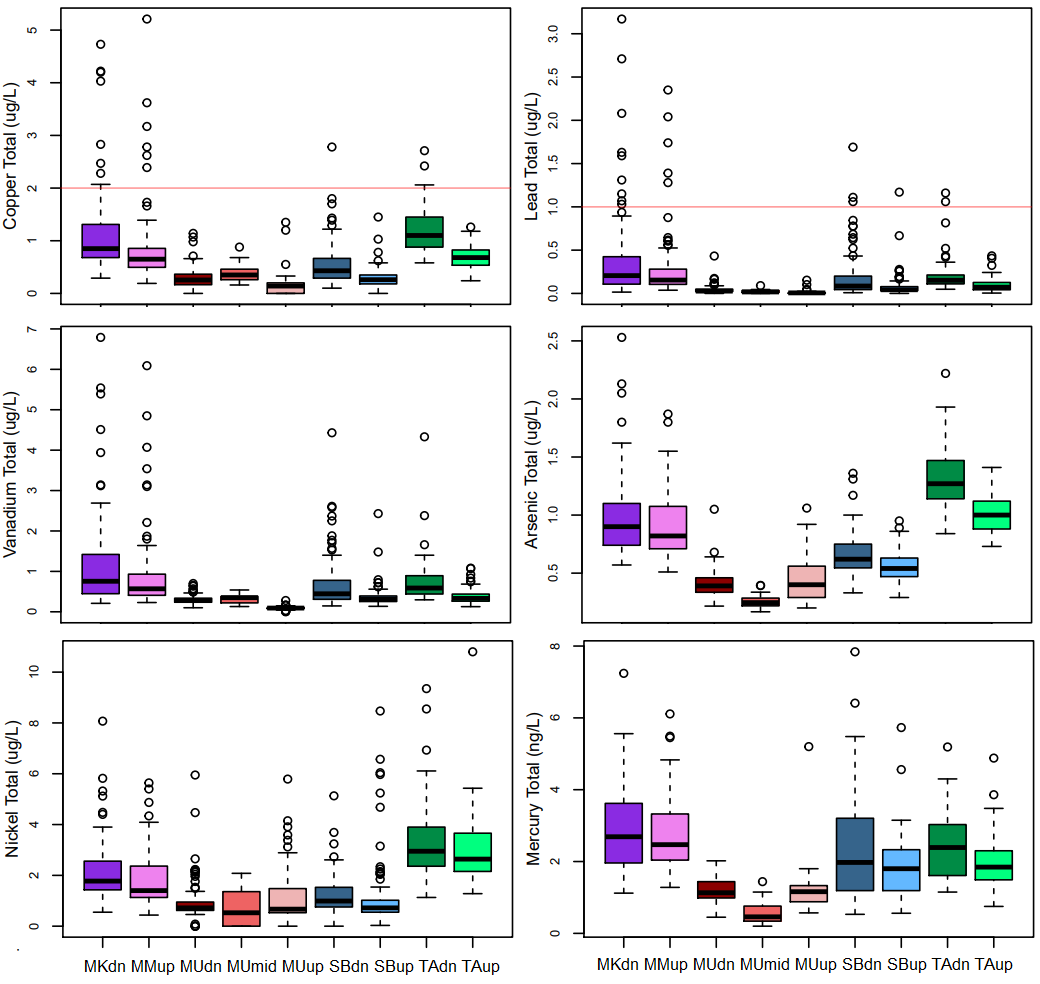
Figure 10. boxplots of a selection of sonde and chemical data, to illustrate the range and non-normal distribution of a large number of the variables at the nine different sites. Canadian water quality guidelines for the protection of aquatic life are included for Cu and Pb (red horizontal lines).
Table 2. Summary of the minimum, mean, maximum and percentage dissolved out of total of concentration of total solids, nutrients, major ions, and trace elements across Mackay, Muskeg, Steep Bank, and Tar Rivers. *The percentage of orthophosphate out of total phosphorus. **The percentage nitrate out of total nitrate+nitrite. ***The percentage nitrite out to total nitrate+nitrite. TKN is total kjedalh nitrogen, and MeHg is methylmercury. A dash is included where the %dissolved/total is not applicable.
Differences between Upstream and Downstream Sites: T-tests
T-tests were performed for upstream versus downstream order for the four tributaries (site Muskeg midstream MUM was excluded from this analysis), for alpha = 0.05 (Table 3). Trace metal (Cu, Pb, V, As, Hg) concentrations were significantly elevated downstream of open-pit mining sites compared to upstream sites. Total suspended solids (TSS) and total dissolved solids (TDS) were also elevated downstream of open-pit mining. However, a close look at the downstream concentration means verifies that concentrations were on average still low at downstream sites, and though statistically significant, some differences are very limited (e.g., mercury concentrations were on average 0.26 ng/L higher downstream and lead concentrations were on average 0.1 ug/L higher downstream), meaning the effect size is low. Notably, Ni and Turbidity mean concentrations were not different upstream vs. downstream of open-pit mining.
Table 3. Output from t-tests preformed on upstream vs downstream order, for alpha = 0.05.

Univariate Correlations for the Athabasca Oil Sands Region
|
An initial analysis of correlation between turbidity or conductivity and water chemistry variables was conducted for data exploration. Pearson correlations were calculated for log-transformed (Table 4) and untransformed data. The following list of variables is described by its element symbol (eg. copper: Cu), followed by T (total) or D (dissolved). TOC and DOC are total and dissolved carbon respectively. Alkalinity (Alk) and hardness (Hard) are also listed.
Log transformed turbidity (logTURB +1) was moderately positively correlated with: VT, PbT, TiT, AlT, TSS, FeT, ThT, ZnT, CoT, CuT, TP, AsT, and MnT (pearson correlation: 0.3 - 0.7). Untransformed turbidity was uncorrelated (pearson correlation < 0.3) with this same suite of variables, as well as with all total trace elements of interest. In contrast, log transformed conductivity (logCOND+100) was strongly positively correlated with: CaT, MgD, CaD, BaD, CaCO3, SrT, and SrD (pearson correlation >0.7). Log transformed conductivity was also moderately positively correlated with: BaT, ClT, LiD, ClD, LiT, TDS, NaD, UD, and BoD (pearson correlation 0.3 – 0.7). Finally, log transformed conductivity was moderately negatively correlated with: AlD, AlT, TSS, PbT, ThD, TiT, VT, ThT, DOC, TOC, TDP, FeD, VD (pearson correlation -0.7 – -0.3). |
Table 4. Pearson correlations of log transformed conductivity (EC) and turbidity (TURB), and other strongly to moderately correlated variables. Trace elements are listed by their element symbol (e.g., Pb for lead), followed by T for total, or D for dissolved. Dissolved and total organic carbon (DOC, TOC), total suspended and dissolved solids (TSS, TDS), hardness (Hard), alkalinity (Alk), and calcium carbonate (CaCO3) are also listed.

|
Variation amongst the Sonde and Water Quality Variables:
Principal Component Analysis (PCA)
|
PCA was first carried out on data from all nine sites (Figure 11), on normally-transformed, centered, and standardized data (z-scores).
PC1 explained 26% and PC2 explained a following 22% of variance within the dataset. Turbidity covaried most strongly with AlT, ThT, PbT, VT, VD, CoT, TiT, all with strong negative loadings on PC1, and weak loadings on PC2. Conductivity covaried most strongly with CaCO3, Alk, CaD, MgD, CaT, BaD, and TDS, with positive loadings on PC1, and negative loadings on PC2. The species scores viewed in combination with loadings reveal certain differences between sites; for example Muskeg River (sites MUdn, MUmid, and MUup) have lower TSS, turbidity, and associated trace element concentrations (AlT, ThT, PbT, VT, VD, CoT, TiT). Mackay River (site MKdn and MKup) have species scores associated with higher TSS, turbidity, and AlT, ThT, PbT, VT, VD, CoT, TiT. |
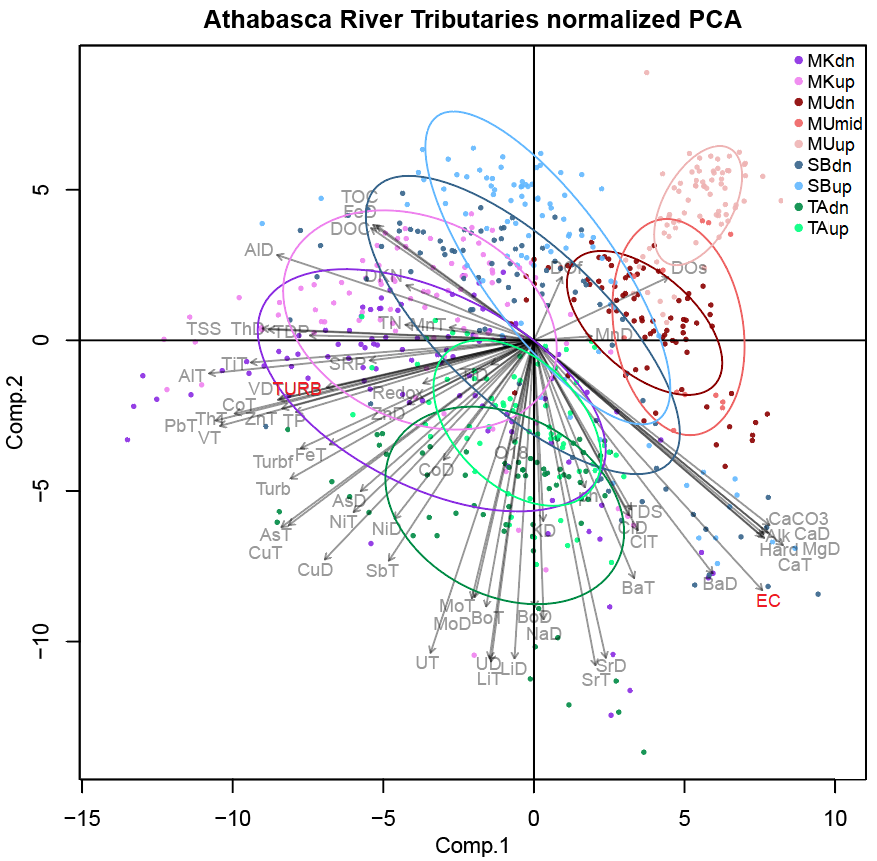
Figure 11. Principal Components Analysis of all sampling events, performed on transformed, normalized and centered data. Elements are abbreviated by their symbol, followed by dissolved (D) or total (T). Turbidity (TURB), conductivity (EC). Alkalinity (Alk), hardness (hard), dissolved oxygen (DO), oxidation reduction potential (Redox), total and dissolved organic carbon (TOC, DOC), total suspended and dissolved solids (TSS, TDS) are also included.
|
Tributaries were next investigated separately, with a PCA computed for paired upstream and downstream (and midstream) stations for each of the four tributaries (Figure 12). Variables split into two predominant, near-orthogonal, groupings in all tributaries with the exception of Muskeg River: (1) turbidity and a suite of predominantly particulate trace element concentrations, including notable trace metals (Pb, V, Ni, Cu), versus (2) conductivity, and a predominantly carbonate associated and dissolved grouping of trace elements (Ca, Sr, U).
At Muskeg River, typically particle-bound PbT, CuT, ZnT and VT trace metals do not covary with turbidity but instead with Na, Cl, and Li.
At Muskeg River, typically particle-bound PbT, CuT, ZnT and VT trace metals do not covary with turbidity but instead with Na, Cl, and Li.
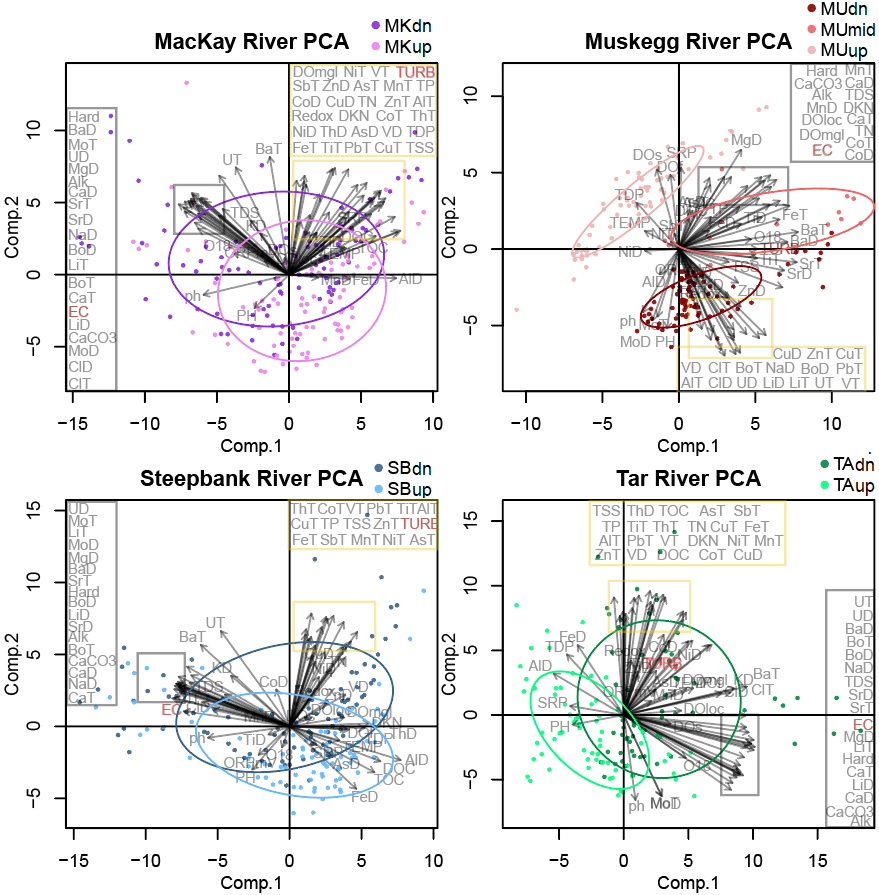
Figure 12. PCA's performed on the four tributaries, on transformed and normalized data. Overlapping variable labels have been shifted from yellow and grey insets to yellow and grey boxes to the outsides of the visualization for ease of reading. Turbidity (TURB) and conductivity (EC) have been highlighted in red font. Elements are abbreviated by their symbol, followed by dissolved (D) or total (T). Turbidity (TURB), conductivity (EC). Alkalinity (Alk), hardness (hard), dissolved oxygen (DO), oxidation reduction potential (Redox), total and dissolved organic carbon (TOC, DOC), total suspended and dissolved solids (TSS, TDS) are also included.
Principal Component Analysis Discussion
Using the PCA, we can visually estimate that differences between upstream and downstream sites are quite limited, there are some notable differences between tributary systems, and that the majority of variation in the sonde and water chemistry dataset can be explained by within site variation. These variations might entail differences in season, discharge conditions, or natural variation.
Muskeg Downstream - a Signal of Brine?
Principal component analysis performed on paired upstream and downstream sites along each tributary revealed a typical division of trace elements into conductivity/carbonate associated elements, and suspended sediment/heavy metal associated elements. This is because in most natural non-ore-bearing settings, heavy metals (e.g., Pb, Cu, Cr, Cd) are typically present in particle-bound phases (such as within a mineral lattice). This typical pattern however, was not the principal division present controlling most of the variation in the Muskeg data set. Instead, the 2nd principal component had high loadings of an atypical element grouping: Na, Cl, Li - components of salt, as well as the heavy metals: Pb, Cu, Zn, and V. Sampling events from MUdn (Muskeg downstream) were associated with higher concentrations of this pairing of elements. We interpret this as a signal of brine leeching into the Muskeg River between the upstream/midstream and downstream station. There is evidence of Devonian and Cretaceous bedrock which contains evaporites which seep into Alberta Oil Sands Region rivers via groundwater (Jasechko et al., 2012). Our results would suggest that these brines may be mobilizing the heavy metals Pb, Cu, Zn, and V in Muskeg River. However, overall heavy metal concentrations at Muskeg River are lowest for our study sites., and do not exceed Canadian water quality guidelines for the protection of aquatic life.
Differences between Sites: Discriminant Analysis
Discriminant analysis showed no overlap between the four tributary rivers (Figure 13); however, there is overlap between upstream and downstream sites along individual tributaries (Figure 13).
Mackay and Tar Rivers had higher values of total suspended solids, turbidity, pH, redox potential (ORPmV), and the total trace metals: V, Na, Th, Ti, Bo, Al, Co, P, Zn, Pb, Fe. Mackay and Tar Rivers also had lowest concentrations of Ca, Mg, Ba, Mn, total dissolved solids, and conductivity (EC), relative to Muskeg and Steep Bank Rivers. This can be seen in the association between Mackay and Tar River species scores, and the loadings of variables on the first discriminant function. These variables--total trace metals: V, Na, Th, Ti, Bo, Al, Co, P, Zn, Pb, Fe, total suspended solids, versus Ca, Mg, Mn, Ba and total dissolved solids--had the strongest control on the first discriminant function (Can 1), which explained 62% of variation among groups.
Downstream sites had elevated concentrations of total and dissolved organic carbon, N, V, Na, Th, Ti, Bo, Al, Co, P, Zn, Pb, Fe, and turbidity relative to upstream sites. This can be seen by the positive offset of downstream sites along the second discriminant function, and negative offset of downstream sites along the first discriminant function. The second discriminant function explained a following 19% of variation between groups.

Figure 13. CANDISC ordination showing largest distribution of variance between groups. Variable labels have been gently shifted to ease reading. Variables in yellow inset are printed in the large yellow box to the side for clarity. Elements are abbreviated by their symbol, followed by dissolved (D) or total (T). Turbidity (TURB), conductivity (EC). Alkalinity (Alk), hardness (hard), dissolved oxygen (DO), oxidation reduction potential (Redox), total and dissolved organic carbon (TOC, DOC), total suspended and dissolved solids (TSS, TDS) are also included.
Differences between Stream Order: Discriminant Analysis
We hypothesized that trace metal (Cu, Pb, V, Zn, Al) and suspended sediment concentrations would be significantly higher downstream of open pit mining activity. T-tests on a selection of variables confirmed that there were significant increases in specific trace metals, suspended and dissolved solids downstream of open-pit mine sites. To view which variables in the water chemistry dataset were elevated downstream of open-pit mine sites we performed a discriminant analysis on stream order.
The discriminant analysis on stream order (upstream versus downstream sites, excluding Muskeg Midstream) revealed that differences were explained by: conductivity (EC), turbidity (TURB), total suspended solids (TSS), total dissolved solids (TDS), as well as mean total element concentrations for Al, Sb, Ba, Bo, Cu, Cl, Fe, Pb, Li, Na, Sr, Th, N, V, and Zn (suffix -T) (positive loadings above the dashed grey line, right panel, Figure 14) which associated with sites downstream of open pit mining (positive species scores, left panel, Figure 14), rather than with sites upstream of open-pit mining (negative species scores, left panel, Figure 14). This confirms that variation between stream order is explained by higher concentrations of trace elements, including potential contaminant trace metals (e.g., Pb, V, Cu) at downstream sites.
In general, nutrient concentrations were relatively higher at upstream sites (e.g., total dissolved phosphorus (TDP), soluble reactive phosphorus (SRP), as well as dissolved oxygen (DO)), as seen as the negative variable loadings, associated with the negative species scores for upstream sites (Figure 14).
Differences between upstream and downstream sites were significant (p-value < 0.001), although the amount of variance in the dataset explained by stream order was low (1%, perManova analysis, Table 5), and the effect size of downstream order was often very small (e.g., mercury was only on average 0.26 ng/L higher, lead on average 0.1 ug/L higher, and copper on average 0.2 ug/L higher at downstream sites (Table 3)).
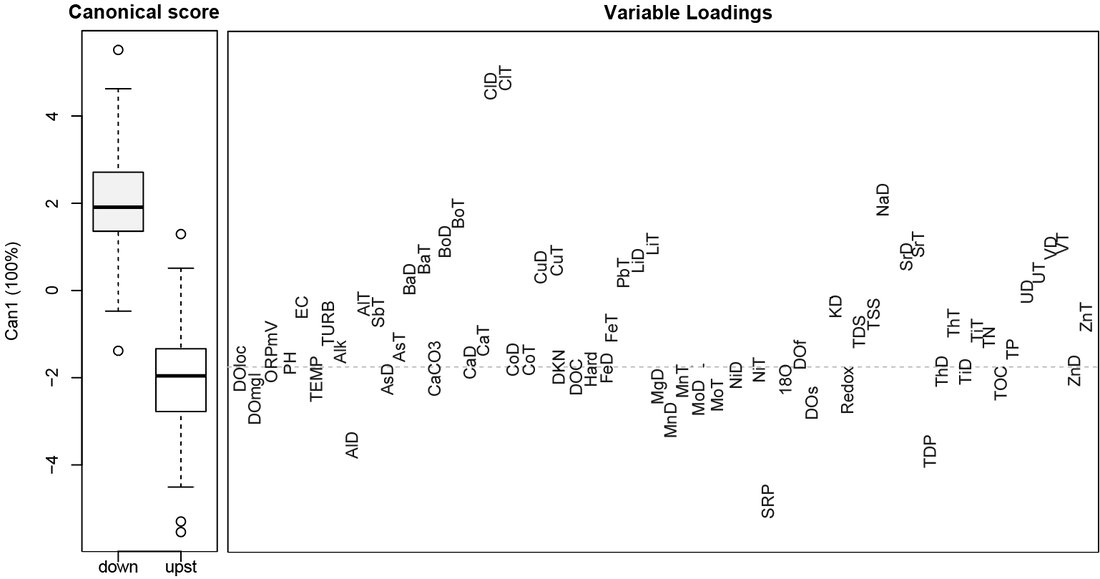
Figure 14. Canonical discriminant analysis of upstream versus downstream order. The boxplot on the left panel displays the first discriminant function score for upstream versus downstream sites, while the panel on the right displays which variables explain the difference in mean score for the upstream versus downstream site. Variables above the dashed grey line have generally higher mean values in downstream sites. Variables below the dashed line have generally higher values in upstream sites. Elements are abbreviated by their symbol, followed by dissolved (D) or total (T). Turbidity (TURB), conductivity (EC). Alkalinity (Alk), hardness (hard), dissolved oxygen (DO), oxidation reduction potential (Redox), total and dissolved organic carbon (TOC, DOC), total suspended and dissolved solids (TSS, TDS) are also included.
Discussion of Variance Explained by Site or Stream Order
|
perMANOVA analysis of tributary system (factors: MK-, MU-, SB-, TA-), stream order (factors: -up or -dn), and mixed effect suggests that differences between tributary systems explain 22% of variance in the data set, stream order explained 1%, the mixed effect explained 2%, and 75% is due to residual error (Table 5). All of the effects were significant (p-value < 0.001).
This means that although there were statistically significant increases in total trace element concentrations downstream of open-pit mine sites, the overall difference between downstream and upstream sites explains only 1% of variation in the water quality dataset. Much more variation is explained by differences between tributary systems (22%), meaning that differences in catchment geology, surficial physiography, aquifer types, geological deposits, etc., have a much larger effect of sample chemistry than location relative to open pit mining. Together these results suggest that natural variability causes more variance in the water chemistry dataset than mining activities do. The most variation is explained by error, which means variables not included in the model. These are likely the manifestation of seasonal variation in water chemistry, perhaps due to varying discharge conditions, precipitation events, channel bank erosion rates, wind blowing in surficial materials, and aquifer infiltration to the rivers. Total trace element concentrations tend to be higher during periods of high discharge when higher loads of sediment are mobilized. All together, the results led me to conclude that regression equations to test the viability of sonde-measured turbidity and conductivity, to model trace element concentrations, should be tested and constructed on a tributary by tributary basis. |
Table 5. output of perManova analysis: variance explained by tributary system (MK-, MU-, SB-, TA-), stream order (-up or -dn), and mixed effects. The *** reflects p-values < 0.001.

|
Tributary Specific Log Log Correlations
Based on the significant differences between tributary systems, but weak differences between upstream and downstream sites, I decided to treat data by individual tributary rather than regionally for all sites in the Alberta Oil Sands Region. With this information, I re-calculated log-log correlations for each tributary system (Table 6).
Table 6. Correlation between Turbidity or Conductivity, and concentration variables. Only variables which had correlations greater than absolute 0.3, and p-values less than 0.001 are reported. Elements are abbreviated by their symbol, followed by dissolved (D) or total (T). Turbidity (TURB), conductivity (EC). Alkalinity (Alk), hardness (hard), dissolved oxygen (DO), oxidation reduction potential (Redox), tempertaure (TEMP), total and dissolved organic carbon (TOC, DOC), total suspended and dissolved solids (TSS, TDS) are also included.

Differences and Similarities between Tributary Specific Correlations
Differences between sites are especially strong between Mackay and Muskeg River. For Muskeg river, there were no strong correlations for trace metals of concern, such as Pb, As, Cu, or Zn. For Mackay, Steep Bank, and Tar Rivers, there were strong to moderate correlations with most of the key trace metals and turbidity. Interestingly, arsenic was better modeled by turbidity at Mackay River, but better by conductivity at Tar River. This may suggest different sources of arsenic in these two rivers; such as a sediment source at Mackay River versus a ground water source at Tar River. Such differences could point to higher toxicity or bioavailability of arsenic at Tar River, however, this would best be evaluated by a detailed examination of redox phase and concentration. For all four rivers conductivity was a strong to moderate modeling variable for Li, Ca, and Sr, and several other typically carbonate associated and dissolved trace elements.
Tributary Specific Regression Models for Key Concentration Variables
I then calculated regression equations for those variables which were correlated to turbidity or conductivity, with a Pearson correlation greater than absolute 0.3 and a p-value less than 0.001 (Equation Sets 1-4). The following moderate to strong regression equations (r > 0.3, p-value < 0.001) may be utilized on a preliminary basis, to predict key water chemistry variables' concentrations at Mackay, Muskeg, Steep Bank, or Tar Rivers:
Equation Sets 1 - 4. Log-log regression equations which utilize Turbidity (TURB) or Conductivity (EC) as a predictive continuous numerical variable, to predict the response trace metal element concentrations. Trace elements are listed as their elemental name, followed by T for total, or D for dissolved. Only equations for elements of interest (Al, As, Ca, Cu, Li, Fe, Pb, U, V, Zn, and TSS) which had a Pearson correlation greater than absolute 0.3, and which have a stronger correlation than the alternative predictive variable, are reported.
|
(1) Mackay River:
Turbidity: log(AlT+1) = 0.7586 x log(TURB+1) + 2.7974 log(TSS+0.1) = 1.0113 x log(TURB+1) - 0.5648 log(ZnT+0.1) = 0.4732 x log(TURB+1) - 0.5862 log(PbT+0.01) = 0.5644 x log(TURB+1) - 2.9790 log(VT+0.1) = 0.3938 x log(TURB+1) - 1.1557 log(FeT+1) = 0.342 x log(TURB+1) + 6.146 log(AsT+0.1) = 0.1088 x log(TURB+1) - 0.2782 log(CuT+0.1) = 0.2107 x log(TURB+1) - 0.6175 Conductivity: log(CaT+1) = 0.9715 x log(EC+100) - 2.4085 log(LiT+1) = 1.040 x log(EC+100) - 3.164 log(UD+0.05) = 1.130 x log(EC+100) - 8.238 (2) Muskeg River:
Turbidity: log(FeT+1) = 0.326 x log(TURB+1) + 6.005 log(ClT+0.1) = 0.463 x log(TURB+1) + 0.1031 Conductivity: log(CaT+1) = 0.7227 x log(EC+100) - 0.6192 log(SrT+1) = 0.8109 x log(EC+100) - 0.2634 log(Alk+1) = 0.4863 x log(EC+100) + 5.4264 |
(3) Steep Bank River:
Turbidity: log(PbT+0.01) = 0.4663 x log(TURB+1) - 3.3973 log(AlT+1) = 0.5592 x log(TURB+1) + 2.8368 log(VT+0.1) = .2631 x log(TURB+1) - 1.1788 log(TSS+0.1) = 0.6120 x log(TURB+1) + 0.3658 log(CuT+0.1) = 0.2102 x log(TURB+1) - 1.2275 log(ZnT+0.1) = 0.2570 x log(TURB+1) - 0.3479 Conductivity: log(CaT+1) = 1.009 x log(EC+100) - 2.457 log(SrT+1) = 1.182 x log(EC+100) - 2.129 log(LiT+1) = 1.069 x log(EC+100) - 3.882 log(UD+0.05) = 0.8939 x log(EC+100) - 7.2281 (4) Tar River:
Turbidity: log(PbT+0.01) = 0.3845 x log(TURB+1) - 2.9473 log(VT+0.1) = 0.2259 x log(TURB+1) - 1.0322 log(FeT+1) = 0.2035 x log(TURB+1) + 6.4091 log(TSS+0.1) = 0.4276 x log(TURB+1) + 0.5929 Conductivity: log(CaT+1) = 1.004 x log(EC+100) - 2.387 log(SrT+1) = 1.313 x log(EC+100) - 2.849 log(LiT+1) = 1.011 x log(EC+100) - 3.168 log(UT+0.01) = 1.423 x log(EC+100) - 9.443 log(AsT+0.1) = 0.4447 x log(EC+100) - 2.4472 |
Can Sondes be Used as Proxies for Trace Metal Concentrations?
The results of the tributary by tributary log-log correlations and regression models suggest that water chemistry, and in particular trace metals of importance such as lead, copper, arsenic, zinc, and vanadium, can be modeled by turbidity with moderate to strong certainty at Mackay River. At Steep Bank River turbidity can be utilized to model lead, vanadium, copper and zinc, but is not recommended for modelling arsenic. For Tar River, turbidity models lead and vanadium with moderate to strong certainty, and conductivity may be utilized to model arsenic with moderate certainty. At Muskeg River, none of the priority contaminants were modeled with certainty, which reflects the unique nature of the water chemistry profile of Muskeg River.
Canadian water quality guidelines for lead and copper were exceeded on between 3 % and 8 % of sampling events at Mackay and Steep Bank Rivers; turbidity modeled lead and copper with moderate to strong certainty at these two tributaries. It is recommended that turbidity be utilized to monitor these two variables in the future on a high frequency basis. Monitoring could even include a remote warning system for times which model water quality guideline exceedances in order to respond to such events in a timely and constructive way. In a similar fashion, turbidity sondes were utilized by Cooke et al (2016) to track a contaminant plume after the Obed Mine coal processing water spill in 2013.
At all four river systems, conductivity strongly modeled calcium, strontium, and lithium concentrations concentrations. Uranium was modeled moderately at Mackay, Steep Bank, and Tar Rivers, but poorly at Mackay.
On the whole, the results suggest that turbidity sondes can be used as a proxy for trace metal concentrations at those watershed which have higher total suspended sediment concentrations. Turbidity therefore likely reflects trace metals transported predominantly in particulate or sediment-bound phase, likely with lower bioavailability. Such sediments are likely mobilized during periods of high discharge. Future work for this study will incorporate daily discharge data to infer associations between trace metal concentrations, turbidity, and daily discharge.
Future Directions
Future investigations in this project will include incorporation of daily discharge data and catchment size to model sediment and trace metal flux and yield from each tributary catchment to the lower Athabasca River.
The scope of the project will also expand from trace metals to nutrients, polycyclic aromatic hydrocarbons, and organochlorines. These compounds are also potential contaminants and toxins which can be mobilized through open-pit mining operations, with adverse consequences for downstream aquatic environments. Each of these chemical concentrations may reveal different patterns and associations with discharge, turbidity, conductivity, reduction oxidation potential, pH and dissolved oxygen.
The scope of the project will also expand from trace metals to nutrients, polycyclic aromatic hydrocarbons, and organochlorines. These compounds are also potential contaminants and toxins which can be mobilized through open-pit mining operations, with adverse consequences for downstream aquatic environments. Each of these chemical concentrations may reveal different patterns and associations with discharge, turbidity, conductivity, reduction oxidation potential, pH and dissolved oxygen.
Conclusion
The Athabasca Oil Sands Region requires high resolution surface water monitoring in order to regulate mine operations and prevent and respond to potential contaminant releases which could jeopardize downstream aquatic ecosystem health. We utilize a two year record of sonde and water chemistry at nine sites across four tributary rivers in the region, with a specific focus on trace metals, to examine differences between tributaries, sites, position upstream and downstream of open-pit mines, and seasonal variation.
The study found that differences between tributary systems were substantial. Mackay River was identified as the highest priority monitoring site, with 8% of sampling events exceeding the Canadian Water Quality Guideline for lead and copper, and generally elevated trace metal concentrations, followed by Tar River.
Overall, turbidity and conductivity showed strong to moderate potential to be utilized as a proxy for total trace element concentrations, including potential trace metals of concern (e.g., Pb, Zn, Cu, As) at Mackay, Steep Bank, and Tar Rivers. The results confirm that sondes are a useful, low cost, low maintenance solution to monitoring trace metal concentrations at the high priority sites in the Athabasca Oil Sands Region.
Disclaimer: all data and writing within this webpage are for statistics-training purposes only, and were performed on test data.
